Showing posts with label nifty. Show all posts

Saturday, June 25, 2011

Nifty and Sensex Wave Count

Sensex and Nifty chart:

This is an entire Sensex count i feel.

I was earlier inclined to think that the rise from 2009 lows till now and the fall from 2008 was a flat ABC structure of wave IV of some degree. However, the longer term sensex chart makes me want to think that things are different. Currently, I think we are in the process of ending Wave V in India.

Based on the charts attached, I think there are two possibilities:
1. We have completed wave V of larger CYCLE / SUPERCYCLE degree (I am bad at assigning cycle degrees); that would be a truncated 5th wave from the bottom in 2009.
2. Other option is, if Friday's and the crucial lows of 5100-5200 zone hold, we might see an upside; which I believe shall be a blow-up top given decaying fundamentals, worse economic situation and backed by phony money called 'QE 3'.


These studies are based on technical analysis and the author nor the webpage shall be responsible for the profits or losses. The author may or may not have personal holding. We are all students

Saturday, April 30, 2011

Nifty Analysis: Oscillators and Elliott

Nifty at key supports: refer the chart
EOD Chart:


30 minute: bit longer term:

Nifty 30 min: close up of the wave structure:


India Vix: for added information:


These studies are based on technical analysis and the author nor the webpage shall be responsible for the profits or losses. The author may or may not have personal holding. We are all students

Saturday, April 23, 2011

Nifty: Candlestick Pattern: DOJI

here is an analysis of the doji days on Nifty


These studies are based on technical analysis and the author nor the webpage shall be responsible for the profits or losses. The author may or may not have personal holding. We are all students

Wednesday, April 13, 2011

Nifty and Banknifty Elliott Wave

Hi Reader,

I have been off with my posts; and i apologize for the delays in the posts. I have being busy with the book "Technical Analysis for Trading Professional". And yes as usual I recommend that book. :P

OK; with today stellar move on the Nifty; I think Nifty is headed up from here. Moreover, Nifty has bounced from its 200 day simple moving average. The candle with high volume is pretty supportive for a rally from here.

Here is the wave count:


 Moreover, now in continuation with the my earlier post on Bank Nifty; this is a further update. On EOD Bank Nifty is still in strong upmove. 

Bank Nifty EOD:

Bank Nifty : Hourly

These studies are based on technical analysis and the author nor the webpage shall be responsible for the profits or losses. The author may or may not have personal holding. We are all students

Saturday, April 2, 2011

Nifty: A simple picture Weekly and Daily

Nifty Daily and Weekly


These studies are based on technical analysis and the author nor the webpage shall be responsible for the profits or losses. The author may or may not have personal holding. We are all students

Saturday, March 5, 2011

Revisiting Nifty Count dated 5th March

I think this count bodes well. Based on this, we have not yet completed  wave 3 down. We are in wave iv of wave 3, full credit for this change goes to Rohit Srivastav. Thanks Rohit.


Here we with the count. 


These studies are based on technical analysis and the author nor the webpage shall be responsible for the profits or losses. The author may or may not have personal holding. We are all students

Wednesday, March 2, 2011

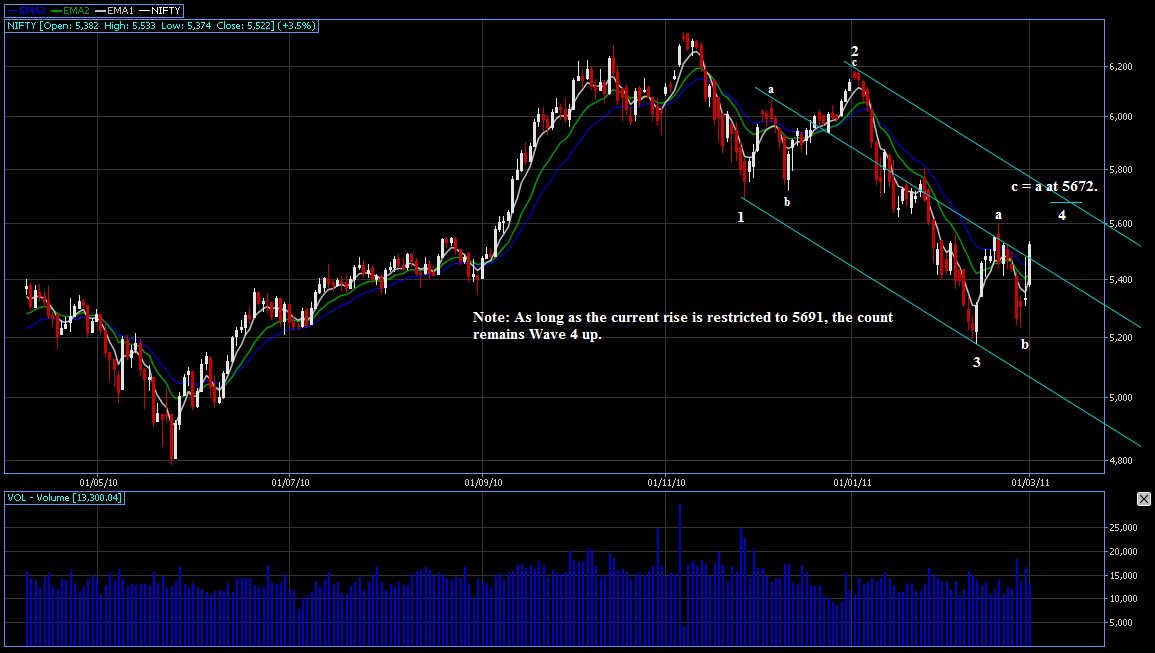
Nifty Elliott Wave Analysis dated 2 Mar 2011

Here we go with nifty wave counts.

I looking at 'wave scenario 1' for Nifty. That is what is preferred scenario. I think that Nifty can do a triangle structure as it would fit the Rule of Alternation. The wave 2 up was a sharp near 80% retracement, which I think shall need to a rather sideways action for wave 4 with a retracement of 38.2%. The 38.2% retracement is approximately 5600.

Moving on to Scenario 2: Nifty can still do a zigzag in this structure.

Alternate 2: This scenario we are looking at zigzag. Assuming wave C is equal to wave A, then we can look at 5672. As mentioned on the chart, as long as the wave are not overlapping meaning wave 4 is not entering into territory of wave 2 and wave 1, we are looking at an impulse structure down.

Alternate 3: Now, there is a rare case there is a possibility that wave 4 can enter into territory of wave 1, which is a Leading Diagonal structure.

Now, lets look at an alternate scenario, which is a rather bullish structure.
The counts marked in RED CIRCLE are larger degree, then counts roman numerals WHITE font and ORANGE squares are of inner degree and finally the orange FONT with smaller font size is more internal count. This a rather wave bullish outlook, based on which we may have started wave iii of wave 5. If this count is something that can occur, then we are looking at massive massive upside on Nifty. To put things in perspective, the wave 1 up was 1572 points and the third wave can even reach 7690.

I donot understand what can of fundamental triggers exist to justify such a move. Only, reason such upside can come is via massive fund infusion in stock market. This can possible if Ben Bernanke does a QE 3 in the US and the money finds its way to all Emerging Markets. This rise shall be somethign absolutely massive with high Precious & Base Metal prices coupled with high Agro-Commodity prices.

Here are the charts:

 Preferred Count:


Alternate: Bearish:


Alternate: Extreme Bullish


These studies are based on technical analysis and the author nor the webpage shall be responsible for the profits or losses. The author may or may not have personal holding. We are all students

Monday, February 21, 2011

Introducing The New Indicator (not yet named it)

Alright, I am working on a Quant Indicator; its still in testing phase.The indicator will help identify stocks with high probability of turn. I am still tweaking the parameters. Right now I have some 74 assets under coverage these are all global assets. Hope to get it up and running by this weekend.

I am herewith attaching the Nifty chart with Indicator readings. The indicator is suggesting that Nifty can do go up from here. 


These studies are based on technical analysis and the author nor the webpage shall be responsible for the profits or losses. The author may or may not have personal holding. We are all students

Sunday, February 13, 2011

Elliott Wave and Market Update for 14 Feb 2011

Here  are the charts of Nifty, Junior, Bank Nifty, Aban and Gitanjali.

The charts are suggesting a short term bounce. However, this bounce can last time. Have the preferred and alternate count on the charts. As usual, let the charts do the talking.

Also one request to the reader, let me know if you need more details on the Chart or more write up explaining stuff or any specific systemic change.


These studies are based on technical analysis and the author nor the webpage shall be responsible for the profits or losses. The author may or may not have personal holding. We are all students

Sunday, February 6, 2011

Nifty Breaking down..

Well it seems nifty is cracking nice and easy. As of now Nifty is working as per the counts I had posted in my earlier blogs

ref here: Nifty intraday
and here: Nifty & Nifty Midcap

Here is an update on the above two posts:


Weekly Chart:


 MONTHLY Sees nice EVENING STAR and a Proper DOUBLE TOP:


These studies are based on technical analysis and the author nor the webpage shall be responsible for the profits or losses. The author may or may not have personal holding. We are all students

Wednesday, January 12, 2011

Nifty Intraday (Going for wave ii up)

Nifty wave up now: Targetting 6k zone.. SL5800


EDIT AT 2.15: There is alternate probability that we are in wave (iv) of wve wave 1 down.


These studies are based on technical analysis and the author nor the webpage shall be responsible for the profits or losses. The author may or may not have personal holding. We are all students

Monday, January 10, 2011

Nifty & Nifty Midcap50

I had posted a sensex long term count. Refer that post while going through this post. i reckon we have completed the 5 wave upside and we are in the midst of a game changing decline in the stock market.  Already I have posted some key breakdowns on the bank nifty and many charts.

 Nifty:
Nifty Midcap 50


 Tomorrow will add more charts detailing the wave counts.


These studies are based on technical analysis and the author nor the webpage shall be responsible for the profits or losses. The author may or may not have personal holding. We are all students

Friday, December 31, 2010

Nifty Valuations

Nifty Valuation based on PE.. PE Bands.. Overvalued based on FY11e PE.

The other two charts are based on trailing 12months PE multiple from NSE site itself.


These studies are based on technical analysis and the author nor the webpage shall be responsible for the profits or losses. The author may or may not have personal holding. We are all students

Nifty . Bank Nifty

Nifty . Bank Nifty

Nifty Preferred and Alternate Counts

Bank Nifty


Wednesday, August 11, 2010

The Long Term Picture: Nifty, Dow Jones, FTSE

We I was missing for a long time, my previous went off the window. But, Reliance totally rocked, in fact, only reliance is falling while, nifty is rising. Although can reach 5500, on a long term,  I am looking at this as a rather formidable wave B top.

Wave Counts of Nifty:
Preferred:

 Alternate:

 World Indices:
Dow Jones: Looks particularly weak and is ready for wave 3 down.


 FTSE: Copy cat of Dow Jones


These studies are based on technical analysis and the author nor the webpage shall be responsible for the profits or losses. The author may or may not have personal holding. We are all students
Thursday, July 8, 2010

Nifty Intraday Update: 8th Jul 2010

Nifty Intraday Update:

Still maintain the bearish perspective on Nifty. Nifty has made a high of 5339.50. Seems nifty may now have completed wavce 2 high. I donot wish to move to alternate scenario.

Possible Wolfe wave in structure in wave c of wav 2. The wave 2 has retraced near 80%. I am now tired of such deep retracements. If this break down, lets see future. For a wolfe wave based target, nifty has 5200 on cards SL 5355.


These studies are based on technical analysis and the author nor the webpage shall be responsible for the profits or losses. The author may or may not have personal holding. We are all students

Wednesday, July 7, 2010

Nifty Elliott Wave Analysis dated 6th Jul 2010

I have been bearish, since my last many posts. And I have not updated blog for long. Now, this is count is only a continuation of my previous posts. I have been counting a completion of Ending Daigonal structure for Nifty at 5398 (7th Apr 2010). The wave 1 completed at 4786 (25 May 2010). This is a 48 days fall. Now, I am considering a time frame based structure, where I am considerinf wave 1 as part 1 of structure and wave 2 as part 2 of tiems structure. Assuming the 48 days as 0.618 of time frame, the balance preiod is 0.382, which works out to 30 days.

Now, 30 days from 25 May works out to 23 June 2010, which should have been the time frame for wave 2. I am counting 5378 as top of wave 2, which is very very deep retracement, but it fits the time equation, considering the top been made a day or 2 in advance on 21 June 2010, from where nifty declined to 5225 on 30 June 2010, which I am considering wave i of wave 1 of wave [3] and the rise today can be considered as wave ii. The structure is still inside the channel.

Although today was a good bullish candle, it still has not broken the high or low of the 30 Jun 2010 candle - 5323 & 5225 - today's range is 5324 - 5233. I still consider it from structure as an Inside Bar structure. On the EMA front, a bear candle could have triggered a 5-13 crossover. The major downside support are as follows:
a. 30 June 2010 low: 5225
b. monthly pivot at : 5209
c. 34 EMA at : 5205
d. 55 EMA at 5178
e. Weekly S1 support at : 5202

A reckon on prefered count scenario to have completed wave ii and Nifty to enter in wave iii of wave 1, whose target is 5166. The major further target for wave 3 is 5082 t0 5050 level. However, tomorrow's price action will determine the market move.

See the EOD chart of Nifty with wave count below:


These studies are based on technical analysis and the author nor the webpage shall be responsible for the profits or losses. The author may or may not have personal holding. We are all students

Friday, June 11, 2010

Nifty Elliott Wave Commentary

Well, today's price action, totally took out my preferred Scenario 3 as posted in my yesterday's blog. However, today mid-market of Inverted HnS post  was timely to point an upward target of 5140. Now, it seems US indices are in wave 2 action.

There is massive cup and handle structure possible on Nifty, which itself has a possiblility to take Nifty to 5505.

The structure marked on the chart is huge Cup and Handle Formation, provided market goes above the lip of cup of 5140. Now, this shall be more important as on today;s candle all 3 important Fibo EMA (5,13,34) shall give a positive crossover - provided that tomo is good follow-up bullish candle.

Based the above conditions, then market can have a target of 5508 for now.

Now, readers would say, that I was massively bearish yesterday and today I am super bullish. Well, the case now is I see a Cup and Handle strucure in making. I am still with my preferred Bearish wave count, which shall hold until top made at 5390 is not breached. Plus, there are major hurdles at 5200 - 5300 marking resistances at each 100 point rise. In case of new high made, I would be prompted to considered


Nifty EOD Chart:


These studies are based on technical analysis and the author nor the webpage shall be responsible for the profits or losses. The author may or may not have personal holding. We are all students

Thursday, June 10, 2010

Nifty Elliott Wave Analysis: 9th June 2010 (for 10 June 2010 onwards)

Elliott Wave Interpretation: The down fall that started from 5397 level, is what I believe to be started for next leg down for market - this can be probably be Primary Wave C or Primary wave 3 for the market. But, that would call for a longer discussion.

Immediate downtrend interpretation: The down trend from 5397 to 4787 is what i have considered as Wave 1 (i have seen many places that this is named as something abcxabc); but i believe this is an impulse action with Wave 1 taking the shape of Leading Wave (since wave 4 enters the territory of wave 1. After the low of wave 1 at 4787, an upward move started, which I consider to be wave 2. Now, wave 2 generally retraces 61.8% to 80% of wave 1.

Now distance covered by wave 1 is [5395 - 4785] = 610 points say 600 points in a span of 48 days (including weekends this is just the total number of days). So based on a 61.8% retracement of wave 1, Nifty had a target of 5155 and 80% retracement a target of 5265. Nifty made a high of 5135 on 4th June 2010. This is 20 point short of 61.8% retracement. That can an acceptable retracement level for wave 2 (for now can be considered).

So considering a scenario that wave 2 have been retraced, we can see a commencement of wave 3. Based on that consideration, wave 3 can be 1.618 of wave 1 which means 1.618 x 600 = 970 (points) from that start of wave 2 (5135). In that case target for wave 3 ideally can be level of 4164. I believe, the wave structure is inline for this target.

Based on the commentary on the chart, there is a Head and Shoulder structure possible with Left Shoulder, Head and a Right Shoulder (underconstruction) with neckline at 4940. A break of this level with volumes, I expect a target of Nifty of 4745 (which would have a Stop loss above the neckline zone). So considering the low of wave 1 is breached on account of this HnS structure, then I would be confident about the target of Nifty at 4164. Now, assuming this fall has commenced, it is not goin to a straight line, but it wil have bounces within its path.

Scenario 2: Considering wave 2 has not completed, in that case, market should bounce at 4940 level, and above 5140 level, there can be a separate Inverted Head and Shoulder pattern for the market with a target of 5400 level, that i cannot rule out. However, for that, market needs to break the high made.

Scenario 3: We are in wave 2, but wave has not ended. As u can see the upside move of wave 2 has been 3 waves a(5070)-b(4940)-c(5135). Now, assuming that we are still in wave 2 and wave is a Flat correction, in that case, based on HnS target og 4745, Nifty's fall stop at previous low of wave 1 at 4785, from where Nifty shall again go up in 5 wave up move. That would also be an ideal scenario based on a time scale analysis. See, the time required for Nifty fall has been 48 days. Considering this 48 days at 0.618 time line and wave 2 to occupy 0.382 time scale so that wave 1 and 2 make up time line of 1x. In that case, wave 2 calls for 30 days of upmove from 25 May 2010. So 30 days more would be 25 June 2010. Also, we know in Flat Wave all waves are generally equal. Putting that for time scale, in tht case, wave A from bottom of 4785 to 5135 has taken 11 days, so 3 wave of equal time line would have mean total time for 3 wave would be 33 days. This is nearly equal to time calculated under first scenario of 30 days. In that case, this Scenario is most likely with possibility of Nifty reaching 4785 by 16 June 2010 and by month end Nifty again reaching 5155 to 5200 levels. This can be an ideal scenario, as it fits both time and price and structural equation. 


Nifty Chart: 30 Min chart


 Nifty EOD Analysis


These studies are based on technical analysis and the author nor the webpage shall be responsible for the profits or losses. The author may or may not have personal holding. We are all students